How many units to order of a product nobody has sold yet
To launch a range of Wi-Fi cameras, we had to decide how many of each model to order without a single sale of our own. I estimated demand per segment from a retail panel and a marketplace, and cleaned a survey that brought in more junk than answers. Rebuilt on synthetic data, with the code.
- Role
- Head of Garza, at Imprex
- Tools
- Python, retail sales panel, marketplace data, Typeform
- Result
- An order per model with three scenarios and a check against the competitor, and a clean survey with the A/B test read with its interval
The problem
In 2026 Garza was preparing a new range of Wi-Fi security cameras, each model aimed at a different kind of buyer. Before launch, two questions had to be answered that don't allow for "we'll see": how many units of each model to order from the supplier, with the months of safety stock set by purchasing, and which pack front works better on the shelf.
There were no sales of our own for those models, because they didn't exist yet. What there was: market data that isn't yours (a retail panel of in-store sales and the best sellers on a marketplace) and the option of asking consumers.
The solution
Demand, per segment and top-down. For each model:
- From the retail panel, sales of the same camera type in the same price band, refined by resolution and power supply where the panel allows it.
- Since the panel doesn't cover every store, offline sales are scaled up by a coverage factor. It's the weakest assumption, so it sits in plain sight as a parameter rather than hidden in a formula.
- From the marketplace, the same category and price band. There are no technical attributes there, so it can't be refined any further.
- Three share scenarios on the segment's market (conservative, base and optimistic), instead of a single number that hides the uncertainty. Two of our models in the same segment split the share; otherwise the brand counts the same market twice.
- The order: the scenario's monthly sales times the months of safety stock.
- A check: base-scenario sales against the reference competitor's on the marketplace. If a model needs to sell more than half of what that competitor sells, it gets reviewed by hand.
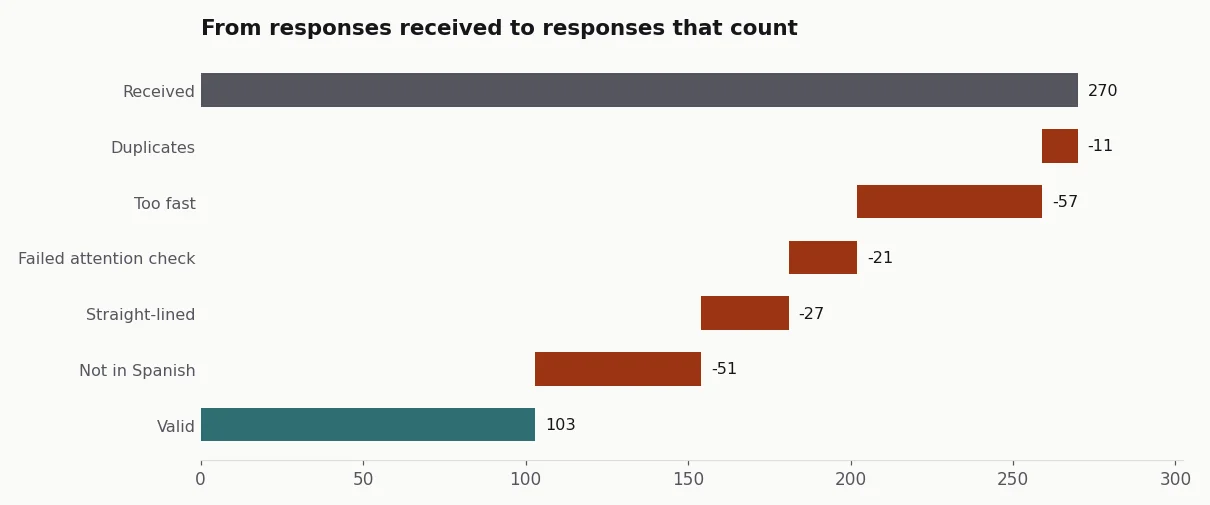
The consumer, with a survey that had to be cleaned before counting. The survey included an A/B test of two pack fronts. The online panel was cheap and brought a lot of junk: bots answering in seconds, answers in other languages, people giving the same answer to everything. More than half of the responses were unusable. Cleaning has to come before any percentage, and each discarded response keeps its reason so the cleaning can be audited.
I also started from buyer personas treated as hypotheses, since they came from secondary sources rather than our own measurement, and crossed persona by camera type to prioritise which models to develop first.
Result
The real figures stay at Imprex, and the market data is licensed. I rebuilt the study on synthetic data with the same shape: a panel, a marketplace, five invented models and 270 survey responses with their junk.
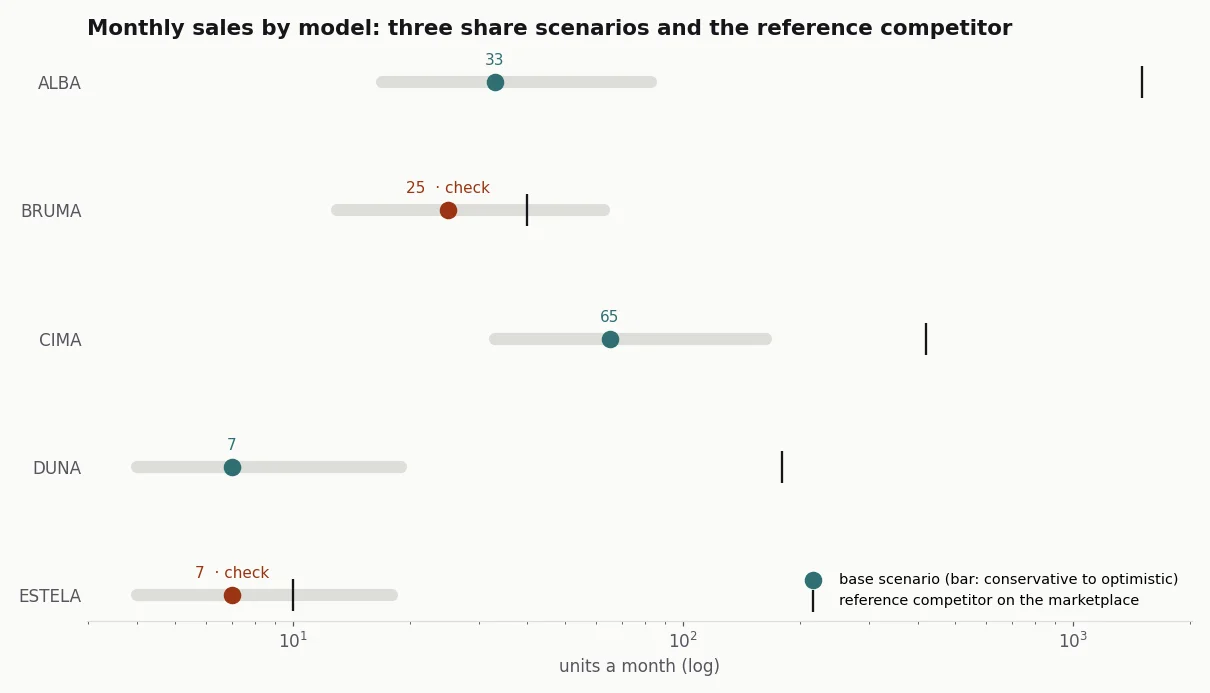
Synthetic data, generated with the case code.
The check flags two models. In both, the reference competitor sells very little for the size of its segment: either it's a niche nobody has taken yet, or the chosen competitor isn't the one that leads. In neither case is market share a good guide, and the order is decided by judgement, not by the formula.
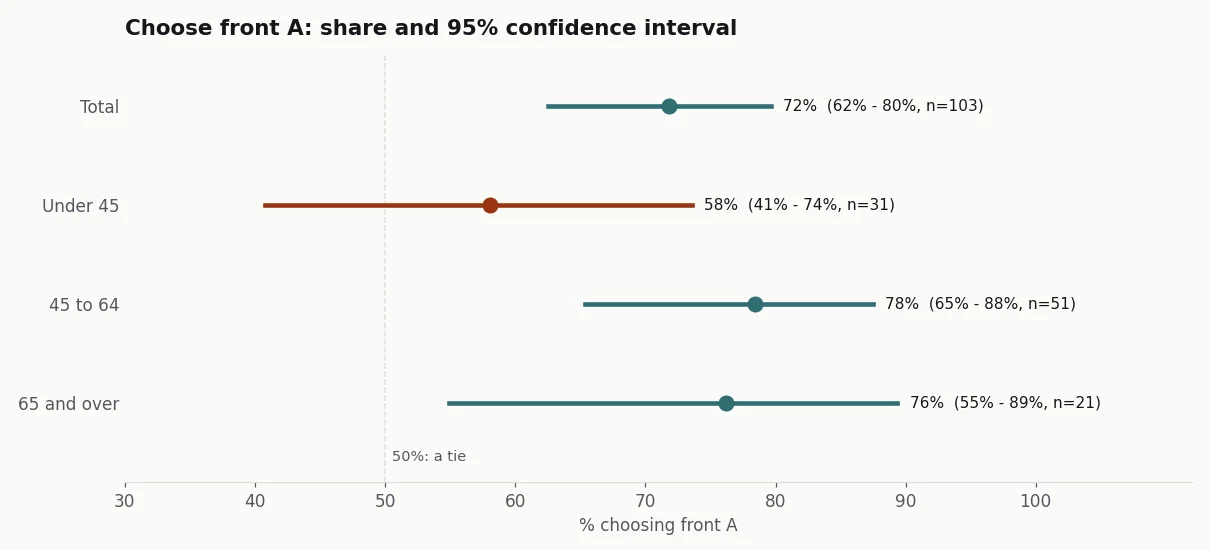
With the valid responses, front A clearly wins overall. By age, the interval says what the percentage alone doesn't: among under-45s, with 31 responses, the interval drops below 50% and you can't claim it wins. With a sample that size, the packaging decision rests on the groups where the result is clear, and the rest is stated as such.
In the real study I delivered the market analysis, the order estimate per model, the range prioritisation, the survey report and the presentation for the sales team. Repeating the survey with a better-quality panel, filtered by language and country at source, was left pending.
How it's built, for anyone who wants the technical detail
- Price bands: fixed cut-offs (<25, 25-35, 35-50, 50-75, 75-100, 100+ €), the same for the panel and the marketplace, so both segments are comparable.
- Share scenarios: 1%, 2% and 5% of the segment's market, split evenly among our models that share it.
- Check: a model is flagged when its base scenario exceeds half of the reference competitor's sales.
- Survey cleaning: five rules in order (duplicate device fingerprint, under a third of the median duration, failed attention check, straight-lined grid and free text in another language); a discarded response keeps the first reason.
- A/B test: Wilson 95% confidence interval, overall and by age.
- Code: acamposla/lanzamiento-camaras, with 21 tests and charts that export in Spanish or English. Code and docs are in Spanish, with an English summary.